Optimization of the nutritional constituents for ergosterol peroxide production by Paecilomyces cicadae based on the uniform design and mathematical model
Shi Fenhui1, Linfu He1, Jingya Qian1*, Zhicai Zhang2,3,4* & Huihua Zheng4
1 School of Food Science and Biological Engineering, Jiangsu University, Zhenjiang 212013, People’s Republic of China.
2 Institute of Agro-Production Processing Engineering, Jiangsu University, Zhenjiang 212013, People’s Republic of China.
3 Zhenjiang Yemaikang Food Bio-Technology Co., Ltd, Zhenjiang 212013, People’s Republic of China.
4 Key Laboratory of Edible Mushroom Processing Ministry of Agriculture and Rural Affairs, Jiangsu Alphay Biotechnology Co., Ltd, Nantong 226009, People’s Republic of China.
*email: sjqjy@126.com; zhangzhicai@ ujs.edu.cn
we optimized medium components for the production of ergosterol peroxide (EP) by Paecilomyces cicadae based on a mono-factor experiment, a uniform design, and a non-linear regression analysis. The maximum EP yield achieved was 256 μg/L, which was increased by 5 folds compared with that before the optimization. Structured Monod model, Andrews model, Contois model, and Aibe model were developed to describe the effects of viscosity inhibition, substrate, and production on biomass growth. The results showed that the Monod model could predict biomass growth, and the effects of viscosity and substrate on the EP concentration were significantly higher compared with the effect of production. The addition of water and glycerol could decrease the viscosity inhibition and glycerol inhibition, and further increase the EP yield. The newly developed structured model was demonstrated for batch growth of P. cicadae.
Ergosterol peroxide (EP: 5ɑ, 8ɑ-epidioxy-22E-ergosta-6, 22-dien-3β-ol) possesses a wide spectrum of biologi- cal properties, such as anti-oxidant1, anti-inflammatory2,3, immune-modulating4,5, and anti-tumor activities, and it can inhibit the activation of renal fibroblasts induced by TGF-16–8. EP mainly comes from the fruiting bodies of medicinal fungi, including Paecilomyces cicadae8, Inonotus obliquus9, Sarcodon aspratus7, Ganoderma lucidum, and Hericium erinaceus10, as well as some yeasts10. Paecilomyces cicadae is a fungal strain belonging to the Paecilomyces genus of ascomycete fungi. In the Paecilomyces, 400 species have been described11. P. cicadae has been used in Chinese herbal medicinal prescriptions to treat many types of diseases, including kidney dis- ease, for thousands of years11–13. P. cicadae has recently received increasing attention due to its reno-protective activity14–16. In our previous study, EP can be isolated and purified from the mycelia of P. cicadae17. EP derived from mycelia can be used to treat renal cell carcinoma in vitro through multiple mechanisms, including sup- pressing cell growth, colonization, migration, and invasion, inducing cell cycle arrest, attenuating β-catenin pathways, and triggering apoptosis17.
Although many types of food and medical fungi can synthesize EP, large-scale production of EP has not been reported. The bottleneck restricting the mass production of EP can be attributed to the extremely low yield of EP. The strategies to increase the yield of fermentation products include screening and breeding of strains and optimization of culture conditions and medical components. The yields of metabolite and biomass are strongly affected by medium composition and cultivation conditions. The medium composition includes carbon sources, nitrogen sources, and trace elements. The cultivation conditions include aeration volume, agitation speed, pH, incubation time, and temperature. Therefore, to increase microbial production with less economic cost, these factors need to be simultaneously optimized. The surface response method, orthogonal design, and uniform design are effective methods to optimize multivariates18–23. As a widely used experimental design of measure- ment uniformity, the uniform design method is first proposed by mathematicians of Wang and Fang in 1978. The basic idea of the uniform design is to arrange the test points at a uniform distribution within the scope. The uniform design is suitable for the test with multiple factors and multiple levels, and it can effectively reduce the cost of the experiment to improve the research efficiency24,25.
Modeling of fermentation kinetics is widely used to control, predict, optimize, and design fermentation processing. All kinetic models of fermentation can be divided into unstructured and structured models. Both types of models are studied to explain the kinetics of biomass and fermentation reactions26–29. The unstructured model (logistic model) applied to several fermentation processes of filamentous fungi may be very useful as data fitters30,31. A great limitation of the unstructured model is that these models are mainly composed of empirical equations, which cannot reveal the mechanisms hidden behind the observed phenomena. The modeling of fungal growth through its biomass is especially interesting for the control of fermentation processes. Therefore, it is necessary to develop more suitable models to provide a better understanding of the mechanisms, which regulate the fermentation process. Although many structured models in the literature fit the microbial growth data well, such as the Monod model, Andrews model (inhibition model by substrate), Contois model (inhibition model by viscosity), and Aibe model (inhibition model by production), these models have not been reported to fit the fermentation process of filamentous fungi.
In the present study, we aimed to optimize the nutritional constituents for P. cicadae to increase the EP yield. The optimization strategy included: (1) the primary nutritional requirement for EP synthesis was achieved by classical mono-factor design; (2) the interaction between nutritional components was achieved by uniform design and statistical analysis; and (3) the interaction between nutritional components was evaluated based on four structured kinetic models.
Results and discussion
Mono-factor experimentation.
Effect of carbon source. The carbon source is a major component of the cytoskeleton in the process of fungal growth, and it provides the energy for biomass growth and metabolite synthesis. Saccharide is the main carbon source for the synthesis of biomass and product in the fungal growth process. Most fungi can grow and synthesize the metabolite in the medium using sucrose, glucose, or maltose as carbon sources32. The effect of carbon sources on EP synthesis is rarely reported in the literature. In the present study, glucose, sucrose, maltose, fructose, mannitol, and glycerol were used as carbon sources to study the ef- fects of various types of carbon sources on the EP synthesis in the fermentation process of P. cicadae. Figure 1 shows that the EP yield was significantly higher when glycerol or mannitol was added into the fermentation broth compared with the other carbon sources (219 and 95.09 μg/L), respectively. The EP yield was significantly higher when the disaccharides (maltose and sucrose) were added compared with monosaccharides (glucose and fructose), while the EP yield between maltose and sucrose or between glucose and fructose was not significantly different.
Carbon source is the main source of nutrients and energy in the process of mycelial growth and metabolite synthesis. Therefore, the type and concentration of carbon source directly determine the specific growth rate, the consumption rate of carbon source, and the synthesis rate of metabolites. In the process of filamentous fungal fermentation, many studies have investigated the relationship between the yield of secondary metabolite and carbon sources. Generally, most organisms prefer to utilize glucose as a carbon source. However, glucose is not conducive to the synthesis of metabolites. The phenomenon can be attributed to the repression of carbon catabolites. Glucose, for example, can inhibit antibiotic synthesis by blocking or inhibiting key enzymes in the antibiotic biosynthetic pathway33,34. As a carbon source, glycerol or mannitol can avoid the inhibition of carbon catabolism. The effect of membrane fatty acids on permeability has been reported35. Few works have investigated the influence of the membrane fatty acids of R. arrhizus cell on permeability. Different components of the culture medium can change membrane composition and lead to the change of cell membrane permeability. The ratio of saturated and unsaturated fatty acids directly determines the permeability of the membrane. Glycerol has been proven to increase saturated fatty acids of cell membrane36. Fatty acid saturation determines the overall stability of the membrane to some extent, while an increase in fatty acid saturation can cause a decrease in membrane fluidity and thus its permeability37, and it blocks the secretion of ergosterol, the precursor of EP, and promotes the synthesis of EP. Therefore, glycerol was chosen as the carbon source in the subsequent experiments.
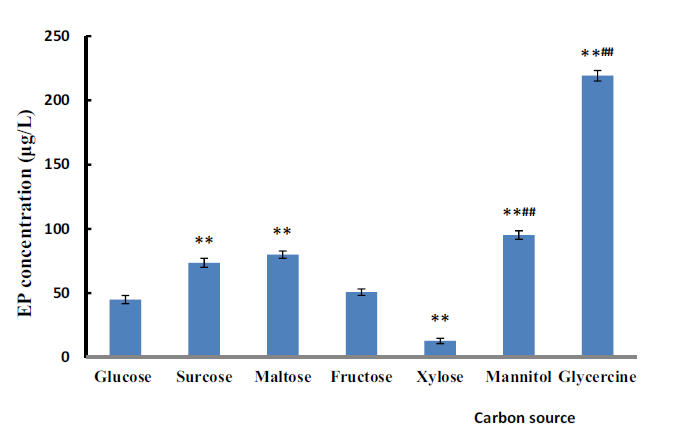
Figure 1. Effect of carbon sources on the EP concentration. **p ≤ 0.01, compared with the glucose using carbon sources; ##p ≤ 0.01, compared with the maltose, sucrose, and fructose using as carbon sources, respectively. The other components of THE medium were the same, and the culture was carried in a rotary shaker at 25 °C and 120 rpm for 48 h.
Effect of nitrogen source. Many fungi can utilize a wide variety of nitrogen sources. The effects of different nitro- gen sources on mycelial growth and product synthesis are very different38. Many nitrogen sources are involved in the synthesis of nitrogen-containing metabolites, such as amino-acid, nucleotides, and vitamins. These amino acids and nucleotides are the precursors of some secondary metabolites39. Therefore, nitrogen sources must meet the needs of mycelial growth and the synthesis of some metabolites. Nitrogen sources can be divided into organic and inorganic nitrogen sources. Peptone, soybean meal, corn syrup, beef extract, and yeast powder are the major organic nitrogen sources, and KNO3, NaNO3, CO(NH2)2, (NH4)2SO4, and NH4OH are the primary inorganic nitrogen sources. Peptone, yeast powder, KNO3, CO(NH2)2, (NH4)2SO4, and NH4OH were used to study the effect of nitrogen source on the EP synthesis by P. cicadae, and the experimental results are shown in Fig. 2.
Figure 2 shows that a significant enhancement was observed when utilizing peptone and yeast powder for EP yield. The maximum EP yield (68.49 μg/L) was obtained when the yeast powder was used as the nitrogen source, followed by peptone (59.38 μg/L). Their EP yields were significantly higher compared with the control group without the nitrogen sources (30.6 μg/L). However, after KNO3, CO(NH2)2, (NH4)2SO4, and NH4OH were added, respectively, the mycelia grew slowly. Moreover, after the fermentation, the dried mycelium was dark, and its EP concentration was less than 26.60 μg/L. The results showed that inorganic nitrogen in the fermentation of P. cicadae was not good for EP production.
The pathway of nitrogen metabolism is closely related to the pathway of secondary metabolite biosynthesis. Nitrogen regulation in fungi has been extensively reviewed40,41. One of the differences between yeast powder and peptone is that yeast powder contains higher levels of biotin. The biotin can increase the cell membrane density, reduce the cell membrane permeability, block the secretion of EP precursor ergosterol, and promote the synthesis of EP. This also led to the highest yield of EP when yeast powder was added. However, excessive biotin prevents the transport of the substrate and metabolites between the extracellular and intracellular. To control the content of biotin in the medium, the yeast powder and peptone were chosen as the nitrogen source in the uniform design experiment.
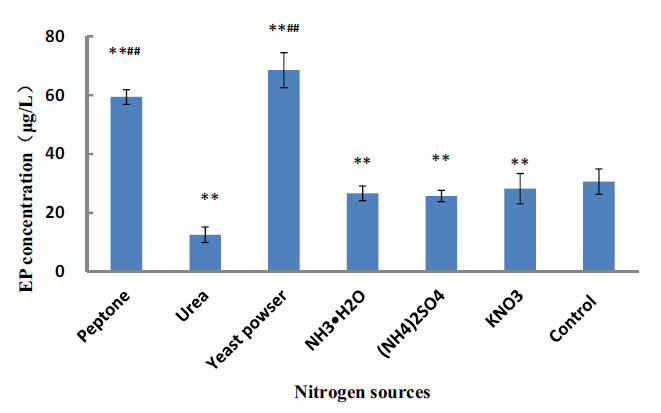
Figure 2. Effect of nitrogen sources on the EP concentration. The control was the medium without nitrogen sources. **p ≤ 0.01, compared with the control group; ##p ≤ 0.01, compared with the groups using NH3∙H2O, (NH4)2SO4, and KNO3 as nitrogen sources, respectively. The other components of the medium were the same, and the culture was carried in a rotary shaker at 25 °C and 120 rpm for 48 h.
Effect of inorganic salt. As the coenzymes of many types of enzymes, inorganic salts play a vital role in the growth and metabolism of microorganisms, the balance of osmotic pressure, and the translocation of nutrients and metabolites between the intracellular and extracellular cells. Therefore, we investigated the effects of six inorganic salts on the EP yield in the broth of P. cicadae, including KH2PO4, MgSO4, MnSO4, CuSO4, ZnSO4, and FeSO4. Figure 3 shows that the EP yield was significantly higher when KH2PO4, MgSO4, and ZnSO4 (32.21 ± 2.41, 38.85 ± 0.75, and 62.23 ± 1.60 μg/L, respectively) were added compared with the control group (no addition of inorganic salt, 28.12 ± 2.03 μg/L). Especially, the increase of EP yield was the most significant when ZnSO4 was added. ZnSO4 is beneficial to the fermentation of Cordyceps jiangxiensis to produce intracellular polysaccharides and mycelia42, which is consistent with our results. The EP yield was significantly low when MnSO4, CuSO4, and FeSO4 were added. Therefore, we chose KH2PO4, MgSO4, and ZnSO4 as the inorganic salts.
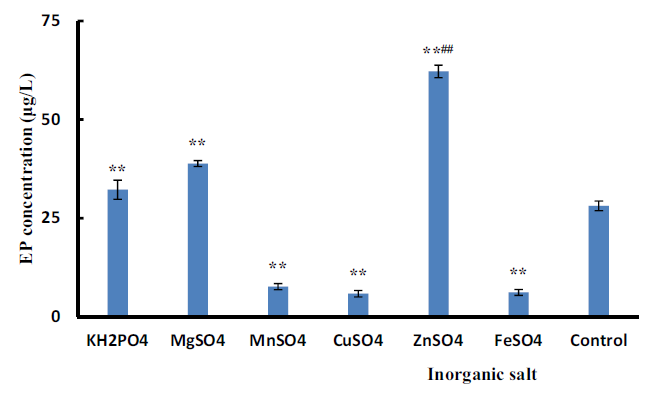
Figure 3. Effect of inorganic salt sources on the EP concentration. The control was the medium without inorganic salt.**p ≤ 0.01, compared with the control group; ##p ≤ 0.01, compared with the groups when KH2PO4 and MgSO4 were added, respectively. The other components of the medium were the same, and the culture was carried in a rotary shaker at 25 °C and 120 rpm for 48 h.
Uniform-design experimentation.
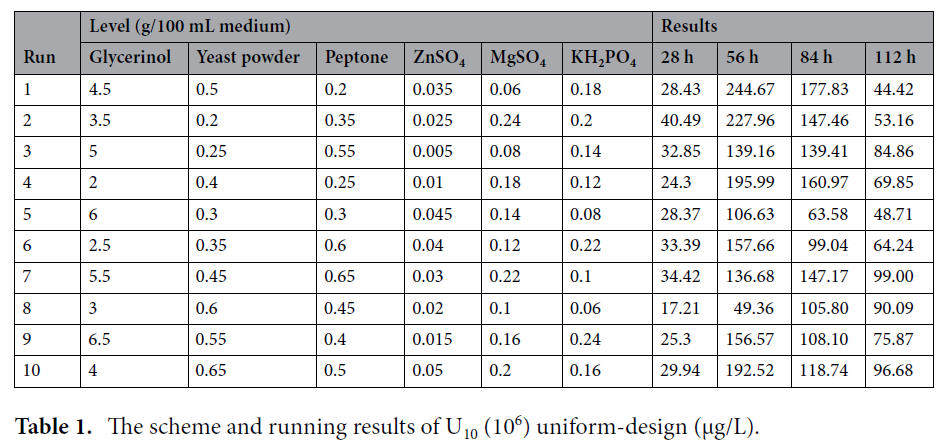
According to the result of the mono-factor experimentation, glyc- erol, yeast powder, peptone, KH2PO4, MgSO4, and ZnSO4 were screened as the independent variables, and U10(106) was applied to investigate the effects of six factors on the EP yield. Table 1 shows the scheme of U10(106). The sampling time was selected as the control variable, which was set at 28, 56, 84, and 112 h. Table 1 shows the experimental results.
To more accurately analyze the relationship between each factor and EP yield, the following formula was used to fit the data in Table 1.

where Fi is the sampling time (T), glycerol concentration, yeast extract concentration, peptone concentration, ZnSO4 concentration, MgSO4 concentration, or KH2PO4 concentration. αi and βi represent the coefficients of factor Fi and F 2, respectively. C represents the fitting constant. Table 2 presents the fitting results. F-value (7.754) and p-value (0.000) of the model with 95% confidence in Table 2 implied that the fitted equation was extremely significant and reliable.
The coefficients of each item in Table 2 were introduced into Eq. (1) to give the following Eq. (2).

The coefficients of F3, F6, and F7 greater than 0 indicated that positive correlations existed between YEP and F3, between YEP and F6, and between YEP and F7, respectively. Namely, the higher concentrations of yeast extract, MgSO4, and KH2PO4 in the tested range of concentration, the higher YEP. The coefficients of F4 and F5 less than 0 indicated that negative correlations existed between YEP and F4, and between YEP and F5, respectively. Namely, the lower concentrations of peptone and ZnSO4 in the tested range of concentration, the higher YEP.
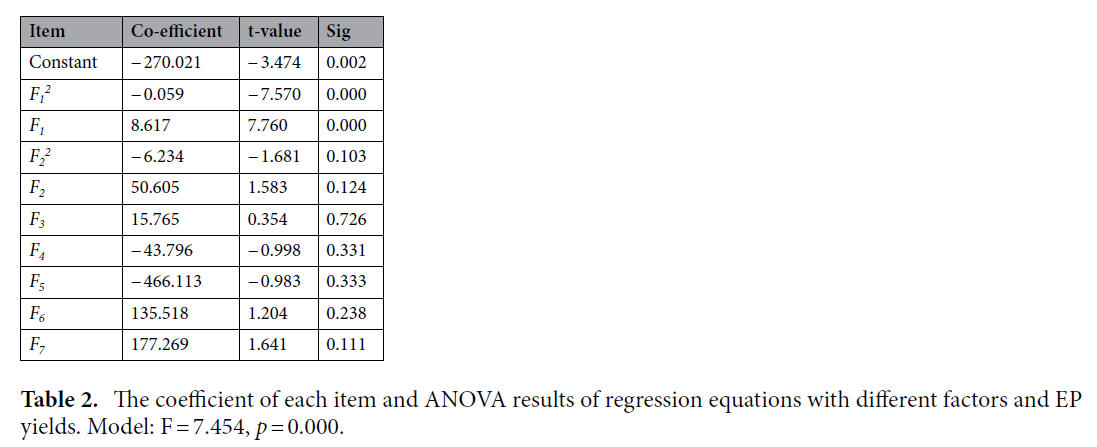
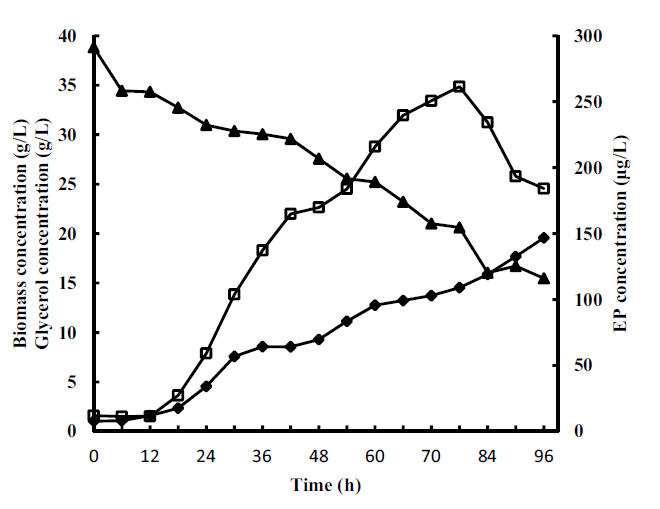
Figure 4. Changing profiles of biomass, EP, and glycerol consumption at different time points. ♦: Biomass concentration; ▲: Glycerol concentration; □: EP concentration.
The coefficients of F 2 and F 2 less than 0 exhibited that there was an inverted-U-shaped relationship between YEP and F1, and between YEP and F2, and YEP had the maximum value. The following two equations were obtained by taking the derivation of YEP to F1 and F2.

Suppose that YEP’ = 0, F1= 8.617/0.118 = 73 h, F2= 50.605/12.468 = 4.06. When the fermentation time was 73 h and glycerol concentration was 4%, the YEP yield reached the maximum value.
To sum up, the optimum fermentation medium of EP contained (g/L): 40 glycerol, 6.5 yeast extract, 2 peptone, 2.4 KH2PO4, 2.4 MgSO4, and 0.05 ZnSO4. The optimum fermentation time was 73 h. To verify the optimiza- tion efficiency, an experiment was conducted with the basal fermentation medium and optimum fermentation medium, and the fermentation time was 80 h. Under the above-mentioned conditions, the maximum theoretical yield of EP is 203.92 μg/L at 80 h. Actually, the measured EP yield with the optimum medium was 256 µg/L and significantly higher compared with the basal medium (43 µg/L) and the maximum theoretical yield.
Kinetic model of growth.
Figure 4 shows the changing profiles of biomass, EP, and substrate in the process of P. cicadae fermentation. The biomass was increased after 12 h, and then it continued to increase rapidly till the end of the growth phase. The EP production was rapidly increased from 12 to 76 h. The maximum EP yield was obtained at 76 h (261.47 μg/L). After 76 h, the EP yield was rapidly decreased (Fig. 4). In the process of fermenta- tion, the glycerol concentration was decreased rapidly from 34.34 to 21.02 g/L.
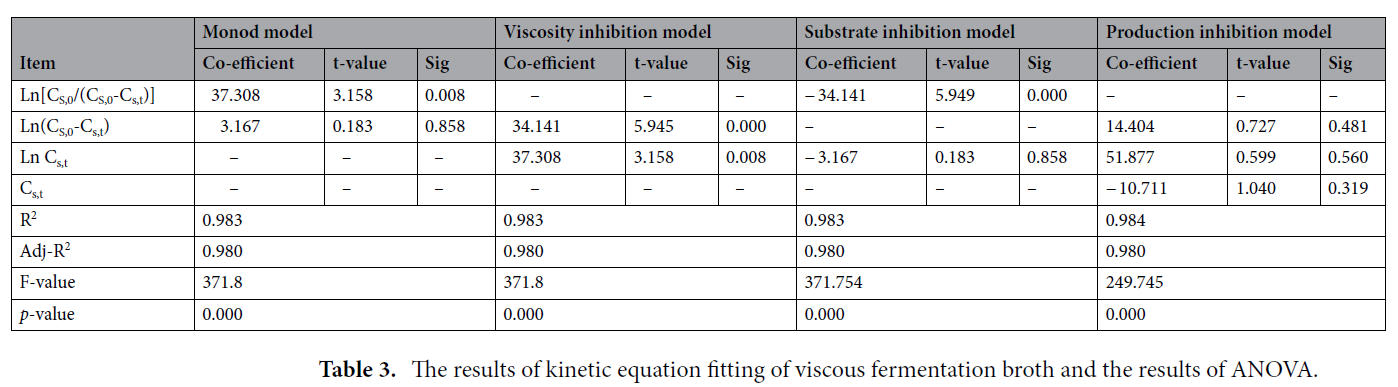
The experimental data of glycerol concentrations in Fig. 4 were fit with Eqs. (9)–(12), respectively (Table 3). The goodness-of-fit R2 values (> 0.98), F-values (> 240), and p-value (0.000) exhibited that these four models simulated better the kinetic experimental data, described the time course profile of EP productivity, and had the high explanation rate and credibility.
Monod and logistic models are adopted as the most applicable models for cell growth. However, in addition to the limitation of nitrogen and phosphorus sources, there is an oxygen limitation in aerobic fermentation. The Monod model is generally constrained due to the presence of oxygen limitation in the aerobic fermentation process. In contrast, the logistic equation can well reflect the relationship between the cell growth rate and the biomass. In fact, in the aerobic fermentation process, the oxygen concentration is steeply decreased in the initial stage of fermentation, and then the oxygen concentration remains constant till the strain begins to die. Therefore, before the strain begins to die, the effect of oxygen concentration on cell growth can be neglected. Although the logistic model can simulate the cell growth of fungi43,44, the model gives very little valuable information. The combination of these four models can evaluate the reasonableness of any parameter changes in the process of fermentation.
Table 3 shows that although the p-value of the four models was 0.000, the F-value of the Aibe model was lower compared with the other models. Based on the F-value, we deduced that the effect of the product on the EP concentration was less compared with the viscosity and substrate. Here, it should be pointed that the product was not only EP but also other metabolites that might inhibit the synthesis of EP. To decrease the effects of viscosity and substrate on EP synthesis in the fermentation process and to increase the EP yield, fed-batch glycerol and water supplementation were used to increase the EP yield. Furthermore, water supplements could reduce the inhibitory action of production on biomass growth.
To verify our deduction, we designed three groups of experiments, and each experiment was carried out in triplicate. The EP yield of group 3 (glycerol supplementation) was 327 ± 4.93 μg/L, which was significantly higher compared with group 2 (water supplementation, 286 ± 3.23 μg/L). The EP concentration of group 2 and group 3 was markedly higher compared with group 1 (no supplementation, 272 ± 1.63 μg/L). The result further proved that the combination of four structured models could guide the optimization of the fermentation process.