接第一篇:
3 Results
3.1 Fungal colonization and total bacterial load following entomopathogenic fungal infection
To evaluate whether entomopathogenic fungal infection influences the composition of the mosquito microbiome, Ae. aegypti mosquitoes were infected with one of four fungi tested: C. cateniannulata, C. amoenerosea, B. bassiana, or C. javanica. Our qPCR assays evaluating fungal load (via 18S rRNA) indicated that all four fungal species achieved statistically significant colonization relative to the uninfected controls (Figure 1A). Cordyceps javanica produced the highest median fungal load (∼47-fold above controls), followed by B. bassiana and C. amoenerosea (both ∼25 fold), and C. cateniannulata (∼8-fold; p < 0.05). Notably C. javanica exhibited substantial inter- individual variability in fungal load, suggesting dose or host- dependent differences in infection. Quantification of bacterial load also showed shifts with fungal infection. In particular, mosquitoes infected with C. amoenerosea had significantly higher total bacterial loads than the control (Figure 1B). The remaining fungal treatments did not significantly alter total bacterial load, indicating that fungal colonization alone does not predict microbiome expansion.
3.2 Entomopathogenic fungal infections lead to genus-level compositional shifts in the mosquito microbiome
To discern the changes in microbiome diversity and composition that occurred under each treatment, we conducted amplicon-based metagenomics targeting the V3 and V4 region of the bacterial 16s rRNA gene from individual whole body mosquito DNA from each treatment group. After quality-filtering, there were a total of 3,285,282 reads with an average of 32,852 reads per sample. ASVs belonging to 4 phyla, 15 families, and 14 genera were identified (Supplementary Figures S1, S2).
To characterize the compositional changes at the genus level, we evaluated the relative abundances of the 10 most prevalent bacterial genera across treatment groups (Figure 2). C. cateniannulata-infected mosquitoes presented the highest relative abundance of both Kluyvera and Pantoea (Figures 2B, I) and C. amoenerosea had a significantly higher relative abundance of Pandoraea compared to all other treatment groups (Figure 2H).
3.3 Entomopathogenic fungal infection reduces microbiome diversity without altering richness
Alpha diversity was evaluated using observed ASVs as well as the Shannon and Simpson Indexes. The analysis of observed ASVs indicated no statistically significant differences detected (p < 0.05) and trends toward lower observed richness were noted in mosquitoes infected with C. javanica (strain 439) (p = 0.0845) and C. amoenerosea (strain 987) (p = 0.1391) relative to controls. A similar but weaker trend was also observed in mosquitoes infected with C. cateniannulata (strain 6241) (p = 0.1567) (Figure 3A and Supplementary Table S2). However, Shannon diversity indices were significantly lower in mosquitoes infected with C. cateniannulata (strain 6241) and C. javanica (strain 439) compared to uninfected controls (p = 0.0108 for both comparisons). No significant differences were detected between controls and mosquitoes infected with B. bassiana (strain 076) or C. amoenerosea (strain 987) or between the fungal-infected groups. Simpson diversity analysis revealed that mosquitoes infected with C. cateniannulata (strain 6241) and C. javanica (strain 439) exhibited significantly lower diversity compared to uninfected controls (p = 0.0104 and 0.0336, respectively). Additionally, Simpson diversity significantly differed between mosquitoes infected with B. bassiana (strain 076) and those infected with C. cateniannulata (strain 6241) (p = 0.0440). No significant differences were detected between other fungal- infected groups or between control and mosquitoes infected with B. bassiana (strain 076) or C. amoenerosea (strain 987) (Figures 3B–C and Supplementary Table S2).
3.4 Beta diversity reveals community restructuring following fungal infections
Beta diversity was analyzed to assess differences in microbiota composition between treatment groups using principal coordinate analysis (PCoA) based on the Bray-Curtis dissimilarity matrix. Beta diversity analysis at the ASV level indicated that the bacterial community composition differed significantly between uninfected controls and mosquitoes infected with C. cateniannulata (strain 6241) (p = 0.0067, R2 = 0.119) and between controls and mosquitoes infected with C. amoenerosea (strain 987) (p = 0.047) (Figure 4 and Supplementary Table S3). No significant differences were observed between controls and mosquitoes infected with B. bassiana (strain 076) or C. javanica (strain 439). In regard to differences observed between treatment groups, substantial differences were noted among fungal-infected groups, particularly between B. bassiana and C. cateniannulata (p = 0.005, R2 = 0.197), between B. bassiana and C. amoenerosea (p = 0.028, R2 = 0.069), between C. cateniannulata and C. amoenerosea (p = 0.005, R2 = 0.1) and between C. cateniannulata and C. javanica (p = 0.047, R2 = 0.076), indicating pathogen-specific impacts on microbiome composition.
To evaluate whether the two independent infection experiments contributed to the observed community composition differences, a sequential PERMANOVA was run with “experiment” entered as the first term followed by treatment (Type-I SS, with 999 permutations). The results indicated that “experiment” explained a significant portion of the total variance (R2 = 0.20, pseudo-F = 24.27, p < 0.001). This reflects the independent preparation of fungal suspensions and mosquito cohorts across runs. Furthermore, “treatment” explained a larger proportion of variance than “experiment” (R2 = 0.25, pseudo-F = 10.25, p < 0.001), and remained highly significant after accounting for batch effect. This indicates that the treatment effect reflects true biological differences in community composition rather than experimental run variation (Supplementary Table S3b). Pairwise comparisons that were adjusted for “experiment” indicated that three additional pairs were significantly different compared to the unadjusted model (B. bassiana vs. C. javanica (p = 0.002), B. bassiana vs. control (p = 0.006), and C. javanica vs. control (p = 0.001)). No previously significant comparison became non-significant after adjustment (Supplementary Table S3c). This indicates that the experimental batch effect was masking real treatment differences rather than creating artifacts. This also further strengthens the conclusion that each fungal species induces a distinct mosquito microbiome community during infection.
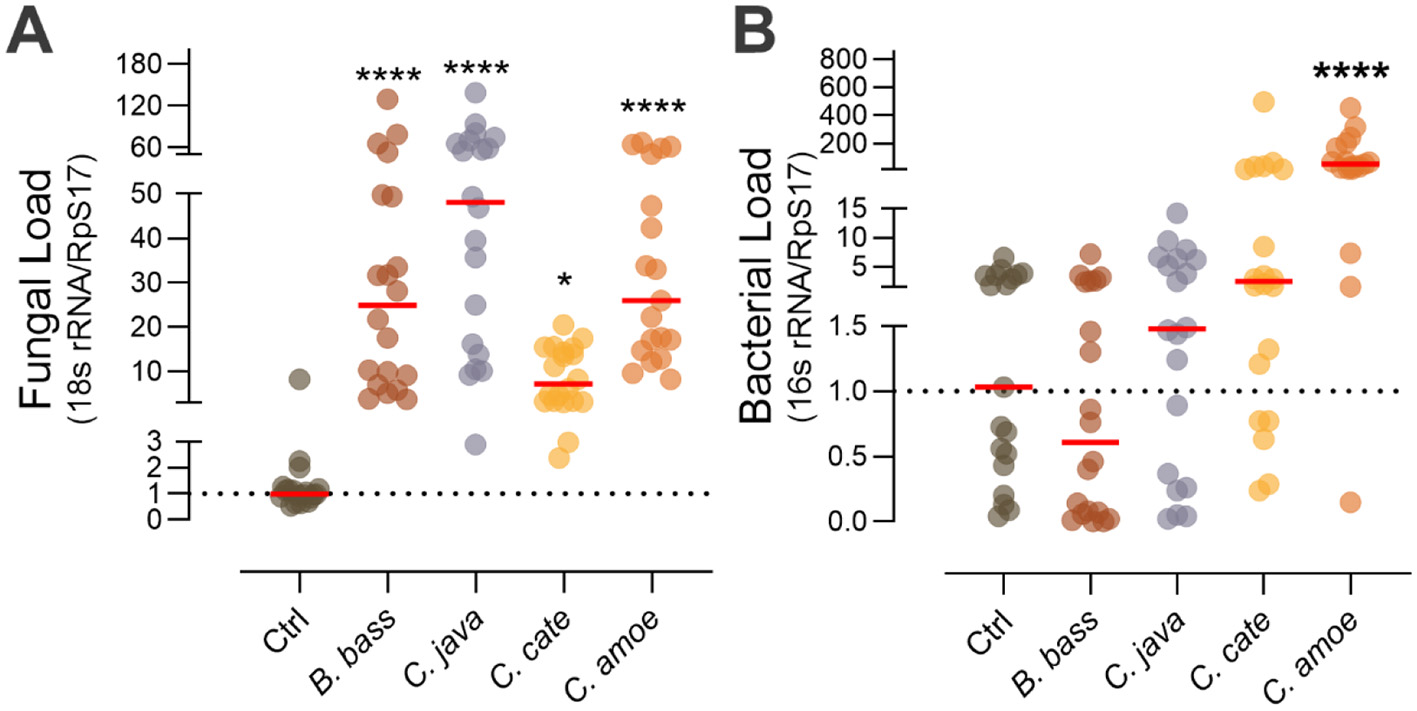
FIGURE 1
Fungal and bacterial load following infection with entomopathogenic fungi. Fungal load (A) and bacterial load (B) in control and fungal entomopathogen-infected mosquitoes. The red line represents the median, n = 20. Significant differences relative to uninfected controls determined by Kruskal-Wallis with Dunn’s multiple comparison test. * P< 0.05, ****P < 0.0001. Ctrl, control; B. bass, B. bassiana; C. java, C. javanica; C. cate, C. cateniannulata; C. amoe, C. amoenerosea.
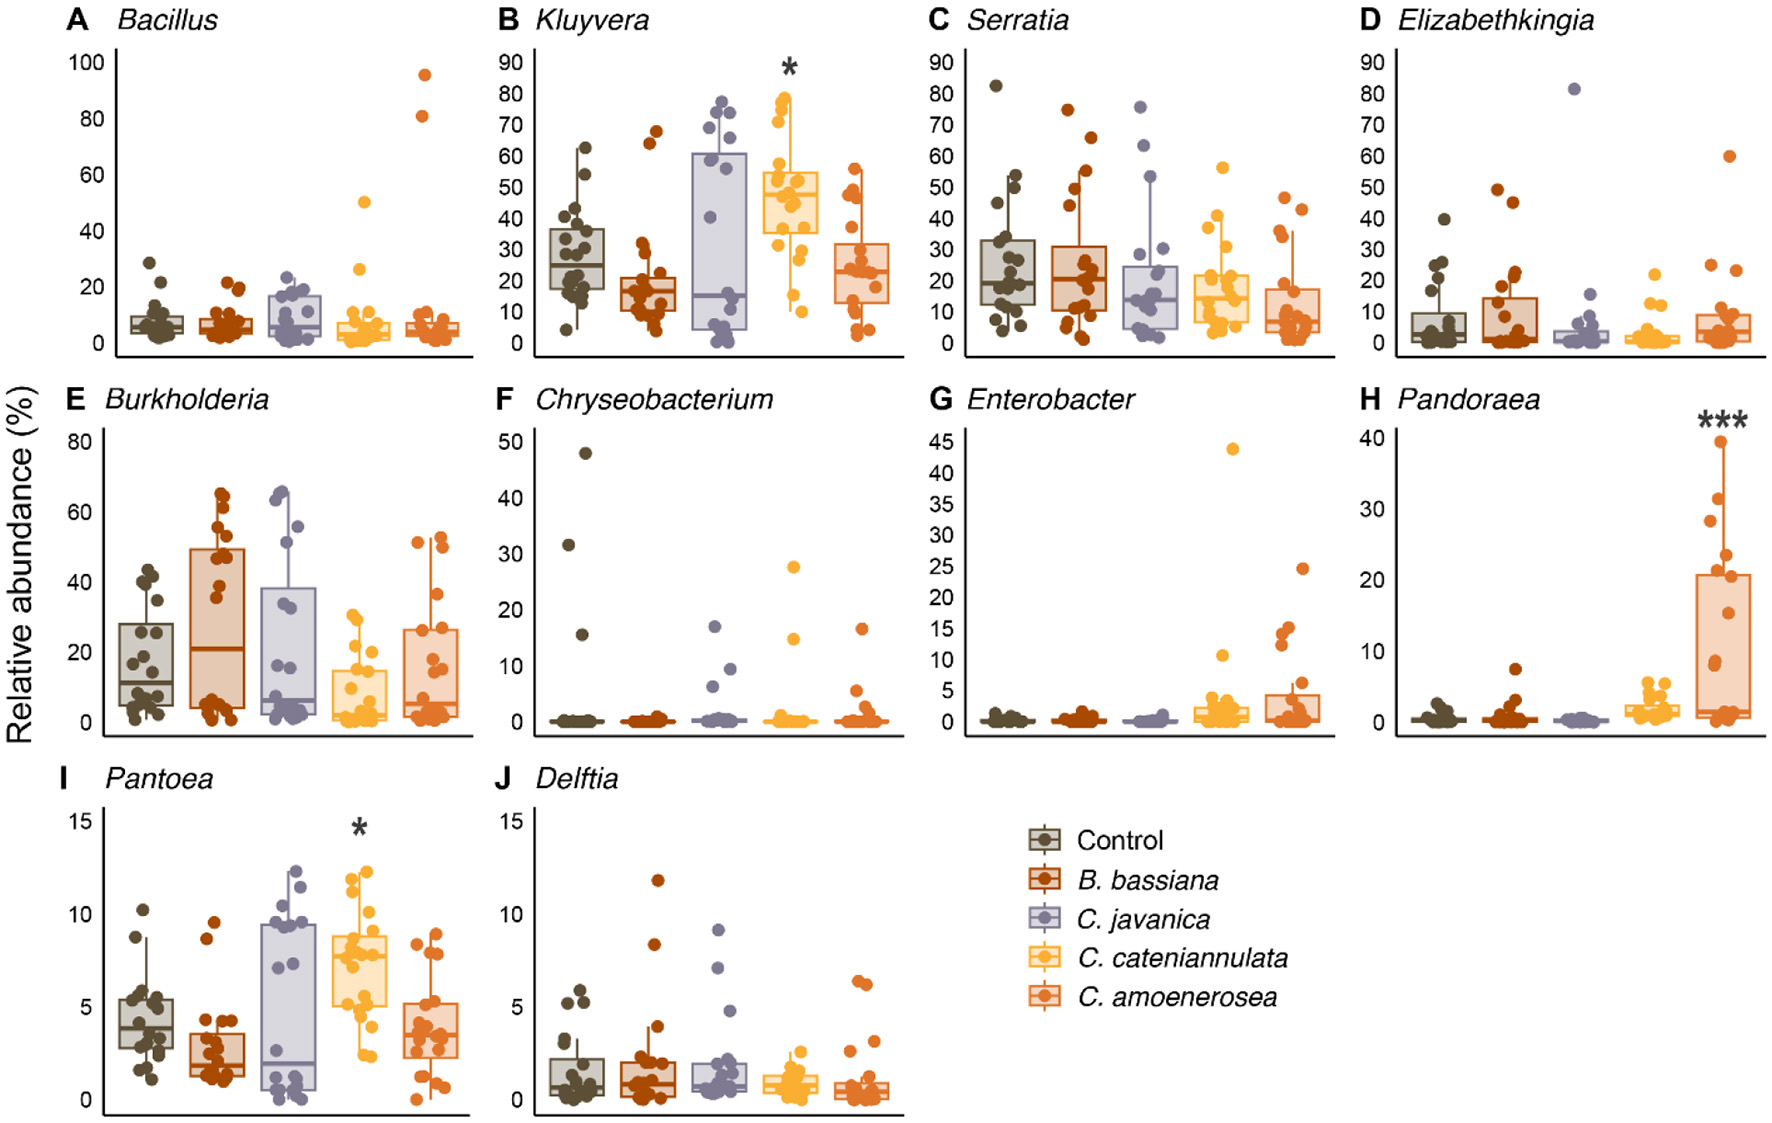
FIGURE 2
Genus-level relative abundance: Relative abundance of the 10 common bacterial genera in uninfected control mosquitoes and mosquitoes exposed to four different fungal entomopathogenic fungi. (A) Bacillus (B) Kluyvera (C) Serratia (D) Elizabethkingia (E) Burkholderia (F) Chryseobacterium (G) Enterobacter (H) Pandoraea (I) Pantoea and (J) Delftia. n=20, significant differences among treatment groups determined by Kruskal-Wallis test with Dunn’s correction. *p < 0.05, ***p < 0.001.
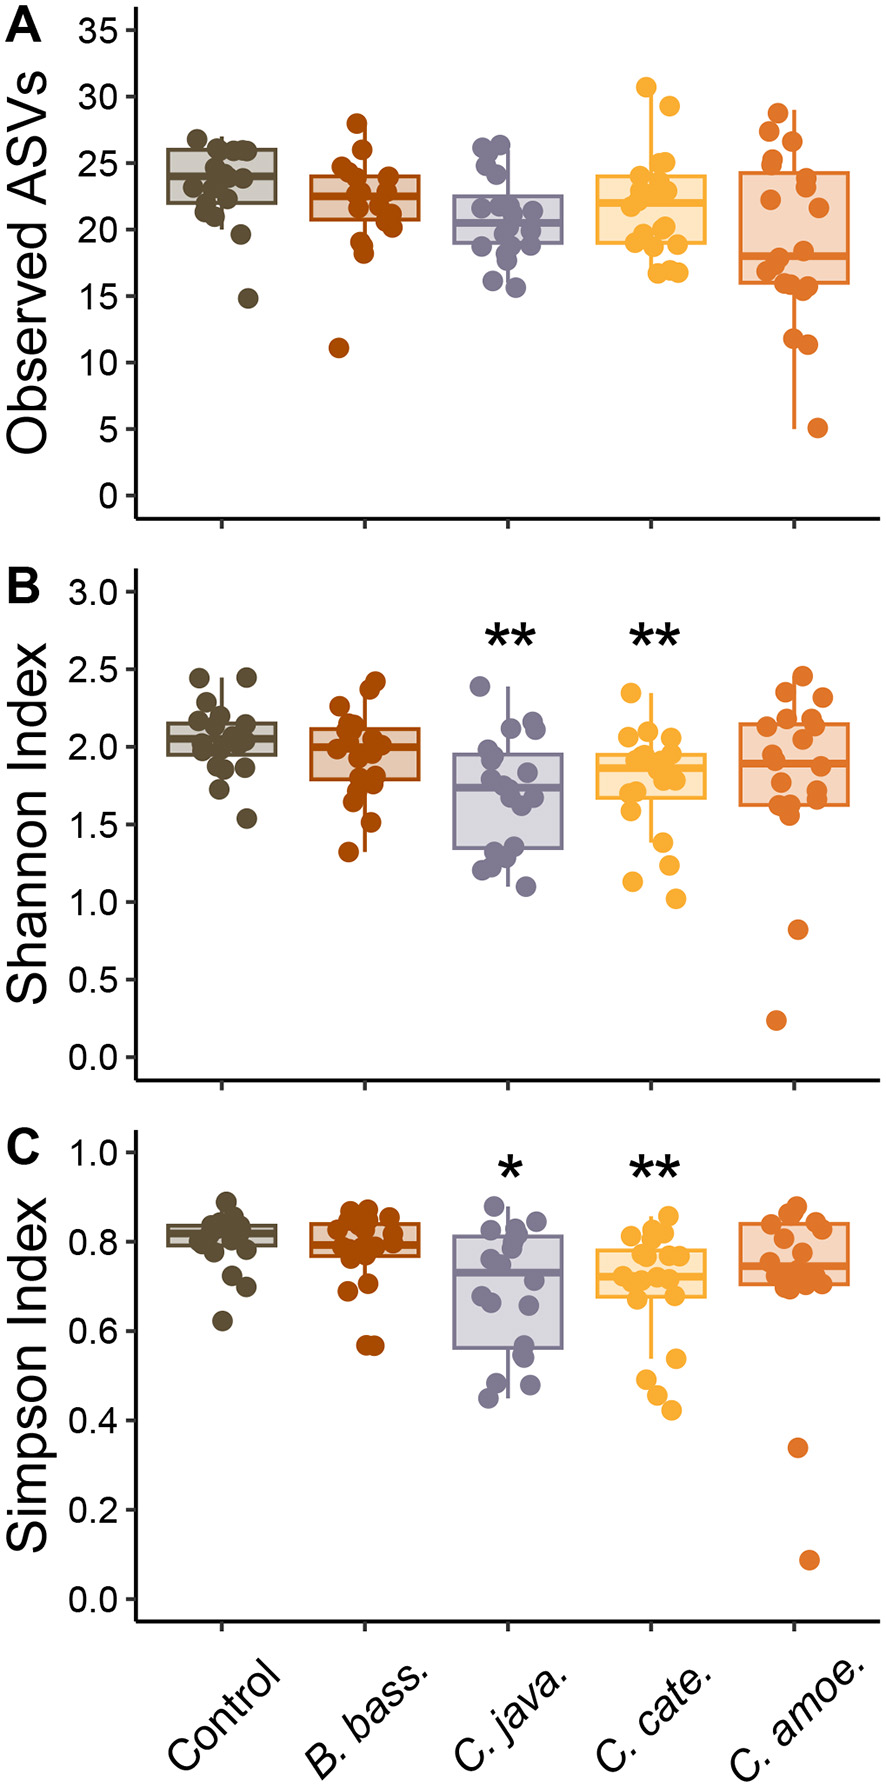
FIGURE 3
Alpha diversity metrics following infection with B. bassiana, C. javanica, C. cateniannulata, and C. amoenerosea. Metrics include the observed number of ASVs (A), Shannon’s index (B), and Simpson’s index (C). n = 20, significant differences relative to uninfected controls determined by Wilcoxon rank-sum test with FDR correction *P< 0.05, **P < 0.01.
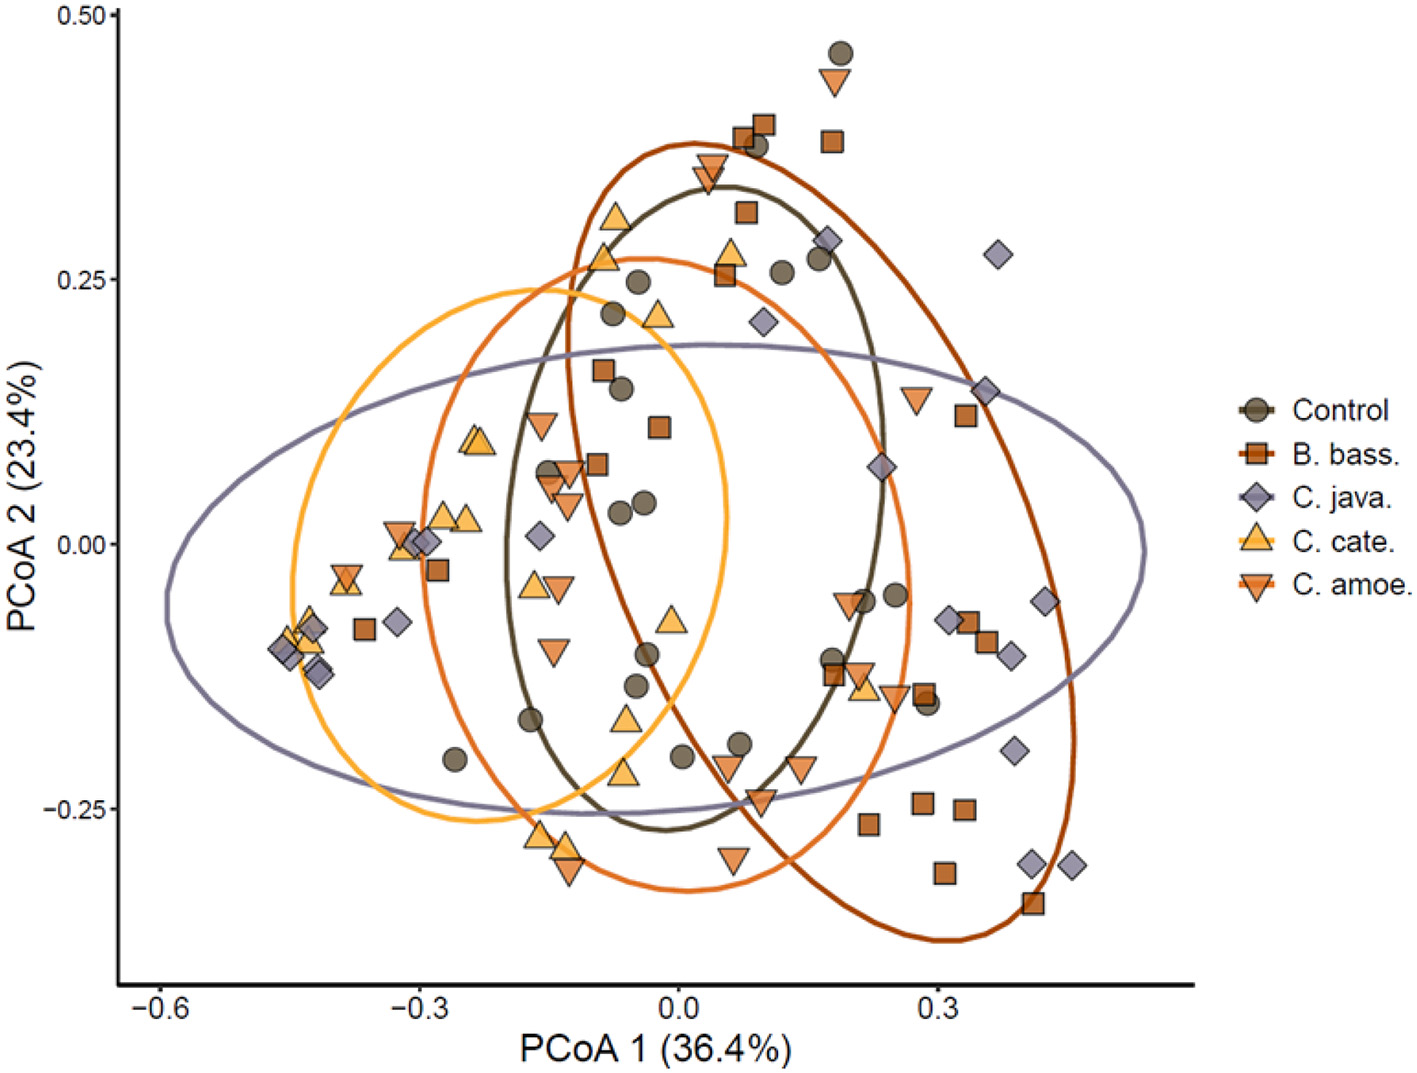
FIGURE 4
Beta diversity at the ASV level following infection with B. bassiana, C. javanica, C. cateniannulata, and C. amoenerosea. Principal coordinate analysis (PCoA) based on the Bray-Curtis dissimilarity matrix.
3.5 Hierarchical clustering identifies contrasting patterns of microbial genera disruption and replacement associated with fungal entomopathogenic infections
Heatmap visualization was used to identify patterns of change in microbial composition and to identify taxa that differ between treatment groups (Figure 5). Hierarchical clustering at the genus level via z-score normalized abundances showed two major bacterial clusters that distinguished B. bassiana from the three Cordyceps species (Figure 5). Infection by B. bassiana resulted in enrichments of Pseudomonas, Nubsella, Burkholderia, and Rhizobium, with weaker enrichments observed within other genera. B. bassiana infections also led to a moderate reduction in Chryseobacterium, Kluyvera and Pantoea (Figure 5). The clustering data indicates that infections with C. cateniannulata and C. amoenerosea have a similar effect on the mosquito microbiome and the greatest changes in composition compared to the control. C. amoenerosea infection leads to a very strong enrichment of a specific cluster of bacteria: Enterobacter, Bacillus, Pandoraea, and Achromobacter. Simultaneously, C. amoenerosea strongly depletes many of the genera that were enriched by B. bassiana infection such as Elizabethkingia, Serratia, Sphingobium, etc. In turn, C. cateniannulata infection strongly enriches Kluyvera and Pantoea, and reduces many of the genera enriched in B. bassiana infection, such as Elizabethkingia, Delftia, Sphingobium, Nubsella, Burkholderia, and Rhizobium. Infections with C. javanica had the smallest effects on composition, clustering closer to the control group, with genera like Delftia and Sphingobium showing moderate enrichments with depletion of Pseudomonas and Enterobacter. Notable was the increase in the abundance of Chryseobacterium and Serratia in the uninfected control group. In contrast, Chryseobacterium was observed to be lower across all infection groups.
3.6 Venn diagram identifies shared and unique bacterial taxa between fungal entomopathogen infected groups
A Venn diagram was generated to view similarities in composition between treatment groups (Figure 6). This diagram highlighted shared and unique bacterial taxa between uninfected and fungus-infected mosquitoes. The Venn diagram reveals that fungal infections decreased the number of unique bacterial ASVs associated with the mosquito microbiome. Uninfected control mosquitoes harbored the highest number of unique ASVs (n = 129, 20% of total ASVs), whereas mosquitoes infected with C. amoenerosea exhibited the lowest number of unique ASVs (n = 52, 8%). Infections with Cordyceps cateniannulata, B. bassiana, and C. javanica also resulted in notable reductions in ASV richness compared to the control. Among all treatment groups, B. bassiana and C. javanica shared the most bacterial ASVs with the control with C. amoenerosea having the least shared ASVs with the control. A conserved core microbiome of 60 ASVs were found to be shared among all treatment groups and the control, with the control having 129 unique ASVs, B. bassiana having 98, C. javanica 100, C. cateniannulata 83, and C. amoenerosea 52 (Figure 6). Our results indicate that many taxa present in the control group are either lost or are undetectable after infection, while new taxa become dominant in the infected groups.
3.7 LEfSe analysis identifies discriminating taxa associated with entomopathogenic fungal infection
Linear discriminant analysis effect size (LEfSe) was performed to identify ASVs and genera that strongly discriminate between each infection group. LEfSe analysis at the ASV level identified nine discriminating bacterial taxa significantly associated with different experimental groups with LDA scores ranging from approximately 3.3 to 5.1 (Figure 7A). Infections with B. bassiana favored ASV7, ASV21 and ASV20, while infections with C. javanica favored the increase of ASV7, and to a minor extent ASV9 and ASV17, while significantly decreasing ASV10 and ASV19 (Figure 7 and Supplementary Tables S4, S5). Infections with C. cateniannulata favored the increase of ASV1, ASV9, ASV17 and ASV18, while suppressing ASV7, ASV21, and ASV20. Infections with C. amoenerosea favored the increase of ASV10 and ASV19 while also suppressing ASV21 and ASV20. Control groups had equal representation with a slight increase of ASV18, ASV20 and ASV21 (See Supplementary Figure S3 for bar chart comparisons).
LEfSe analysis at the genus level identified four bacterial genera significantly associated with different treatments (Figure 7B). This analysis indicated that infections with C. cateniannulata favored the increase of the genus Kluyvera and Pantoea and a decrease of the genus Burkholderia; in particular, the genus Kluyvera showed the highest LDA score (∼5.2), indicating a strong association (Figure 7B and Supplementary Table S6). Infections with B. bassiana favored the genus Burkholderia but suppressed the genus Kluyvera and Pantoea. A slight increase in the genera Burkholderia and Kluyvera as well as the suppression of Pandoraea were observed in mosquitoes infected with C. javanica. Infections with C. amoenerosea favored the increase of the genus Pandoraea but slightly suppressed genera Kluyvera and Burkholderia (Figure 7 and Supplementary Figure S4). These LefSe-identified discriminating taxa represent candidates based on within-dataset analysis and would require independent validation in additional mosquito cohorts or field-collected populations before being considered biomarkers of fungal infection.
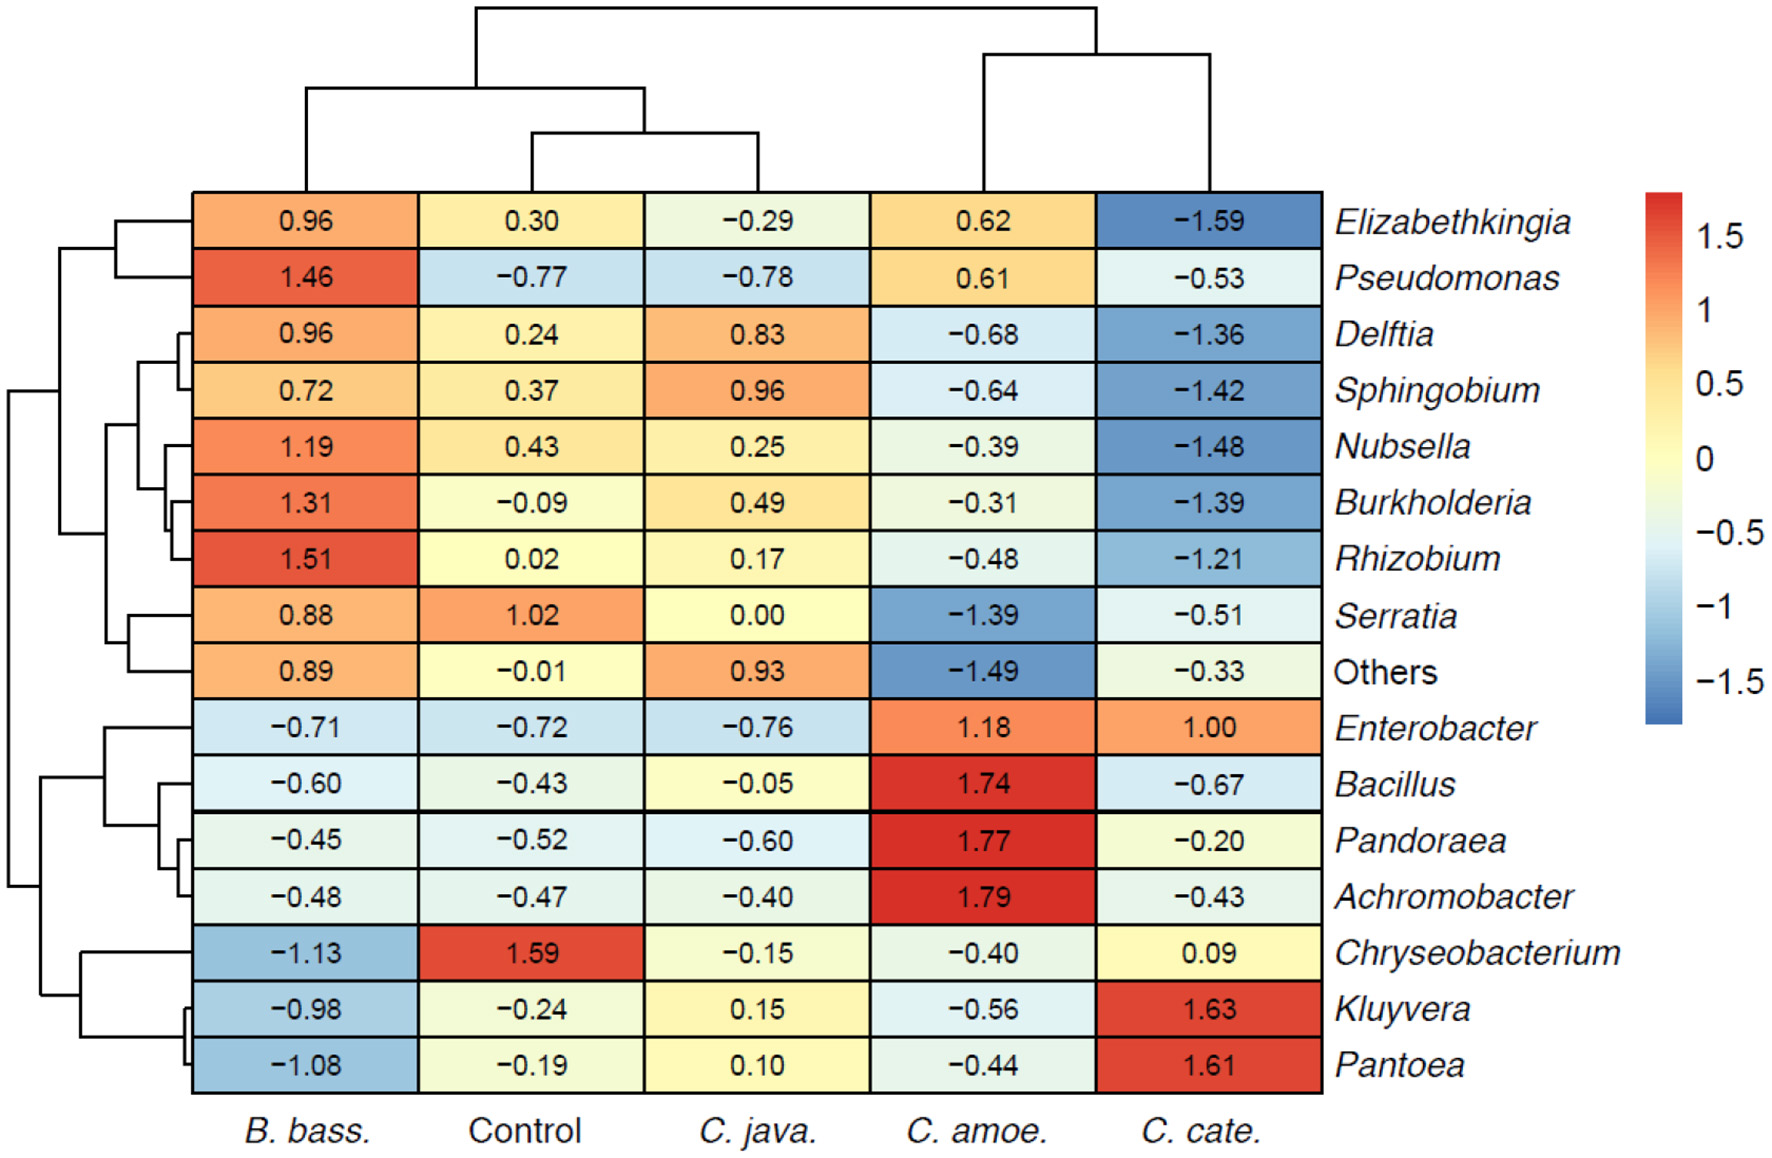
FIGURE 5
Differential impact of fungal entomopathogen infections on mosquito microbiome composition. Heatmap illustrating the Z-score normalized relative abundance of the 16 most abundant bacterial genera within the mosquito microbiome across infections with four different fungal entomopathogens. Each row represents a specific bacterial genus, and each column represents an experimental treatment: B. bass. (B. bassiana infection), Control (uninfected mosquitoes), C. java. (C. javanica infection), C. amoe. (C. amoenerosea infection), and C. cate. (C. cateniannulata infection). The Z-score in each cell quantifies the deviation of a genus’s relative abundance from its mean across all samples, with positive values (red/orange) indicating enrichment and negative values (blue) indicating depletion. Both bacterial genera and treatment groups are hierarchically clustered based on similarity in their abundance profiles, as shown by the dendrograms. Two major treatment clusters are evident: B. bassiana (left cluster, enriched for Pseudomonas, Nubsella, Burkholderia, Rhizobium) and the three Cordyceps species (right cluster), with C. amoenerosea and C. cateniannulata showing the most pronounced shifts relative to controls.
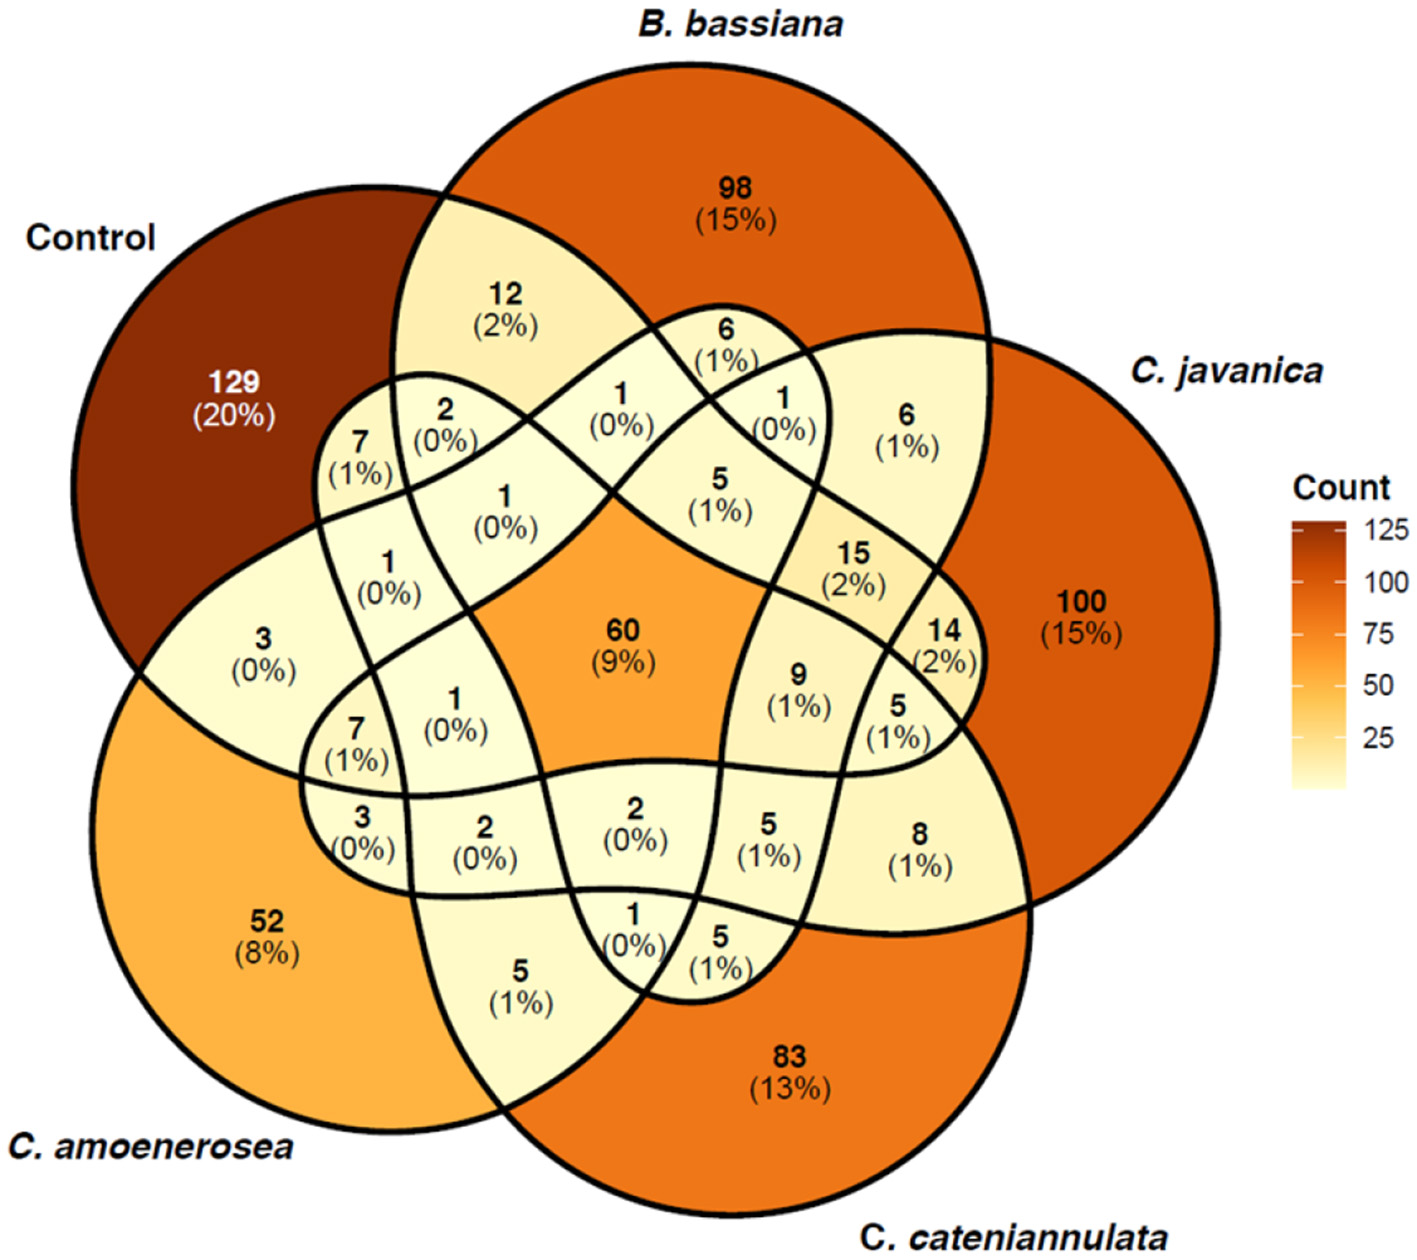
FIGURE 6
Shared and unique bacterial ASVs across fungal entomopathogen infection groups in mosquitoes. Venn diagram illustrates the distribution of unique and shared bacterial ASVs across control mosquitoes and those infected with four different fungal entomopathogens species: The color scale bar indicates the count of microbial ASVs within each region, ranging from 25 (light yellow) to 125 (dark brown). The diagram indicates a stable core microbiome alongside significant shifts in microbial community composition induced by different entomopathogenic fungal infections.
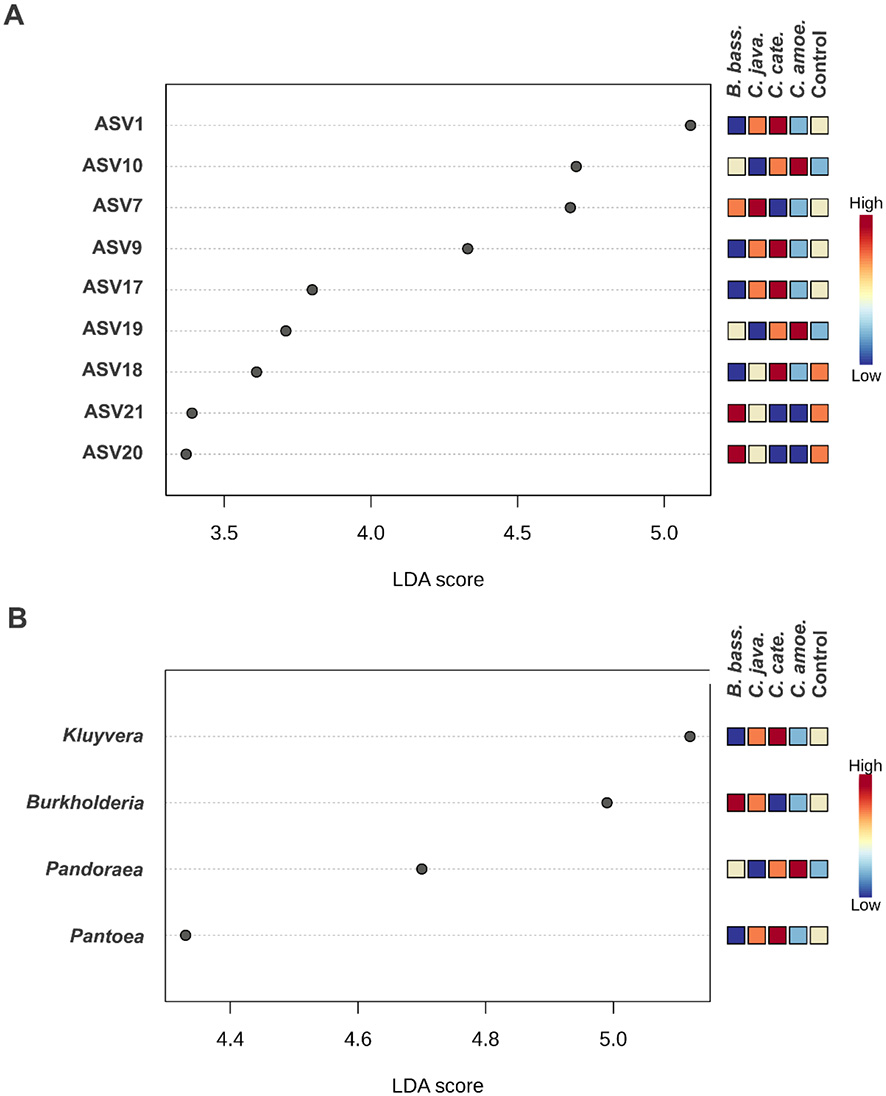
FIGURE 7
Linear discriminant analysis effect size (LEfSe) highlighting significant infection-associated discriminating taxa at the (A) ASV level and (B) genus level associated with fungal infection by each entomopathogen. Entomopathogenic fungi represented include B. bassiana (076), C. javanica (439), C. cateniannulata (6241), and C. amoenerosea (987).
3.8 MaAsLin2 and EdgeR analyses validate heatmap and LefSe findings and identify additional associations at the genus level
MaAsLin2 and EdgeR analysis confirmed the primary LefSe findings across all four fungal infections and identified additional associations at the genus level that were not detected by LEfSe (Supplementary Tables S7, S8 and Supplementary Figure S3). Pandoraea enrichment under C. amoenerosea, the strongest LEfSe discriminator for this species, was confirmed by both methods (MaAsLin2: Log2FC = +4.17, FDR = 4.22E-8; EdgeR: Log2FC = +4.85, FDR = 6.13E-9). Burkholderia depletion under C. cateniannulata, the second strongest LEfSe discriminator, was also confirmed by both methods (MaAsLin2: Log2FC = −2.74, FDR = 1.14E-5; EdgeR: Log2FC = −1.46, FDR = 4.81E-2). Achromobacter enrichment under C. javanica was confirmed by both methods (MaAsLin2: Log2FC = +2.03, FDR = 2.18E-2; EdgeR: Log2FC = +2.34, FDR = 4.67E-2), representing a new association not detected by LEfSe. Enterobacter enrichment was additionally confirmed by both methods under C. amoenerosea (MaAsLin2 FDR = 4.71E-5; EdgeR FDR = 2.81E-3) and C. cateniannulata infection (MaAsLin2 FDR = 5.95E-4; EdgeR FDR = 3.48E-2), also not among the LEfSe discriminators for either species.
Apart from these agreements across methods, MaAsLin2 recovered the two primary LEfSe enrichment signals for C. cateniannulata: Kluyvera (Log2FC = +1.09, FDR = 3.50E-3) and Pantoea (Log2FC = +0.47, FDR = 4.70E-2), which were not detected by EdgeR at the genus level, likely because these signals are specific to ASVs (which are diluted during genus-level aggregation). MaAsLin2 also identified depletion of Burkholderia, Serratia, Sphingobium, and Nocardioides under C. amoenerosea (all FDR ≤ 0.05). These agree with the heatmap showing a broad depletion of core microbiome members under this infection. EdgeR identified a broader depletion of core taxa under C. cateniannulata, including Sphingobium, Elizabethkingia, Delftia, Serratia, and Nubsella (all FDR ≤ 0.05) and the depletion of Chryseobacterium and Kluyvera under B. bassiana (FDR ≤ 2.40E-3). These are also in agreement with the heatmap. No genera reached significance under B. bassiana in MaAsLin2, reflecting the differences that exist at the ASV- level within the Burkholderia, with opposing directional shifts at the ASV level cancel during aggregation at the genus level. Pseudomonas enrichment under C. amoenerosea was identified by EdgeR (Log2FC = +3.28, FDR = 2.12E-3) and agrees in direction with a positive Z-score trend in the heatmap (+0.61), but did not reach significance in MaAsLin2, suggesting that this was a modest signal below the threshold for batch-corrected detection.